Citylab reports that Chicago's open-sourced food safety analysis software has made our food inspectors much more effective. Other cities aren't adopting it, though:
Chicago started using the prediction tool for daily operations in February 2015, and the transition worked very smoothly, says Raed Mansour, innovation projects lead for the Department of Public Health. That’s because the department was careful to incorporate the algorithm in a way that minimally altered the existing business practices. Inspectors still get their assignments from a manager, for instance, but now the manager is generating schedules from the algorithm. The department will conduct an evaluation of the program after a year, and Mansour anticipates that the performance will meet or exceed the metrics from the test run.
But that was never meant to be the end of it. Back in November 2014, Schenk published the code for the algorithm on the programming website GitHub, so anyone in any other city could see exactly what Chicago did and adapt the program to their own community’s needs. That’s about as far as they could go to promote it, short of knocking on the door of every city hall in America. But the months since then have shown that it takes more than code to launch a municipal data program.
Chicago passed around the free samples, but a year later only one government has taken a bite: Montgomery County, Maryland, just northwest of Washington, D.C. The county hired a private company called Open Data Nation to adapt Chicago’s code for use in the new location. Carey Anne Nadeau, who heads the company, ran a two-month test of the adapted algorithm in fall 2015 that identified 27 percent more violations in the first month than business as usual, and finding them three days earlier.
There's a classic anti-pattern called "not invented here." That may be one of the factors. Another could be that the other cities' tech staff just aren't interested in trying new things. Chicago hasn't always been ahead of the curve, but I'm glad we've at least got the one guy.
It's a slow, agonizing death:
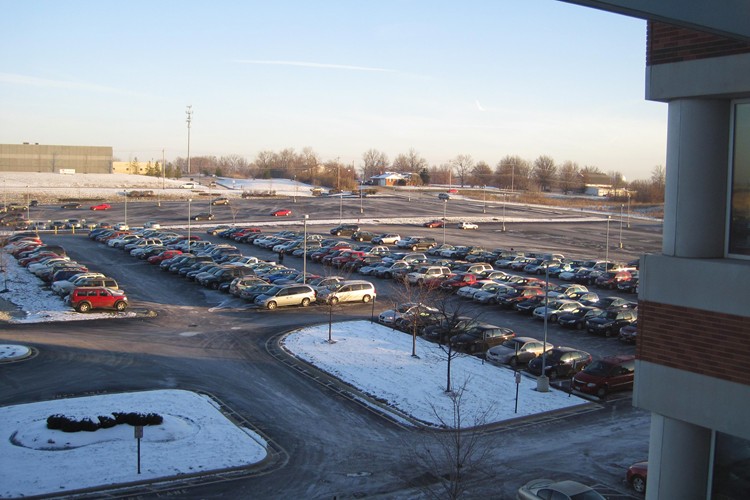
A report from the real estate service firm NGKF released late last year provides new numbers on an ongoing phenomenon: the slow, agonizing death of the American office park. The report looks at five far-flung office tenancy submarkets—Santa Clara, in the San Francisco Bay Area; Denver; the O’Hare region in Chicago; Reston/Herndon outside of Washington, D.C.; and Parsippany, New Jersey—and finds a general aura of decline.
Between 14 and 22 percent of the suburban office inventory in these areas is “in some stage of obsolescence,” suggesting that between 600 million and 1 billion square feet of office space are far from ideal for the modern company and worker. That’s about 7.5 percent of the country’s entire office inventory.
I would almost rather go to prison than work in a suburban office park. I mean, take this one outside Cincinnati, for example. I can't believe I had to spend four weeks there:
The New York Times Magazine has an in-depth analysis of the daily fantasy sports (DFS) industry. I'm not that interested in fantasy sports, but this article had me riveted:
Here’s how it works: Let’s say you run D.F.S. Site A, and D.F.S Site B has just announced a weekly megacontest in which first place will take home $1 million. Now you have to find a way to host a comparable contest, or all your customers will flee to Site B to chase that seven-figure jackpot. The problem is that you have only 25,000 users, and the most you can charge them to enter is $20 per game (anything higher is prohibitively expensive). And you’ll need $2 million or even $3 million in a prize pool if first prize is valued at $1 million (remember, you still have to pay second place, third place and beyond). So you need to somehow quadruple the number of entries. But how? You’re already paying high cost-per-acquisition fees to sites like RotoGrinders, which charge, according to Harber, anywhere between $100 and $200 per person they refer to your site, and you’ve already put your logo on every bus, trash can and ESPN screaming-heads show out there. You’ve also kicked in some of your own money (known as “overlay”) to spice up the pot.
The solution is simple: You let each contestant enter hundreds of times. But even given this freedom, a majority of people will enter only a few more times, which will help but probably won’t get you all you need. If, however, you can attract a few high rollers who are willing to book several hundred or even several thousand entries apiece, the path to the $1 million first prize becomes a lot more manageable. And as long as you can make sure those players keep pouring in their thousands of entries, you can keep posting the $1 million first prize all over your ads.
In the game lobbies of DraftKings and FanDuel, however, sharks are free to flood the marketplace with thousands of entries every day, luring inexperienced, bad players into games in which they are at a sizable disadvantage. The imbalanced winnings in D.F.S. have been an open secret since this past September, when Bloomberg Businessweek published an exposé on the habits of high-volume players. The numbers are damning. According to DraftKings data obtained by the New York State attorney general’s office, between 2013 and 2014, 89.3 percent of players had a negative return on investment. A recent McKinsey study showed that in the first half of the 2015 Major League Baseball season, 91 percent of the prize money was won by a mere 1.3 percent of the players.
So, how is this at all fun to casual players? Someone explain it to me.
Last week, NASA announced data that show this year's El Niño event keeps growing, possibly even surpassing the 1997 event. But they can't yet predict the consequences:
While scientists still do not know precisely how the current El Niño will affect the United States, the last large El Niño in 1997-98 was a wild ride for most of the nation. The “Great Ice Storm” of January 1998 crippled northern New England and southeastern Canada, but overall, the northern tier of the United States experienced long periods of mild weather and meager snowfall. Meanwhile, across the southern United States, a steady convoy of storms slammed most of California, moved east into the Southwest, drenched Texas and -- pumped up by the warm waters of the Gulf of Mexico -- wreaked havoc along the Gulf Coast, particularly in Florida.
"The water story for much of the American West over most of the past decade has been dominated by punishing drought," said JPL climatologist Bill Patzert. "Reservoir levels have fallen to record or near-record lows, while groundwater tables have dropped dangerously in many areas. Now we’re preparing to see the flip side of nature’s water cycle -- the arrival of steady, heavy rains and snowfall."
In 1982-83 and 1997-98, large El Niños delivered about twice the average amount of rainfall to Southern California, along with mudslides, floods, high winds, lightning strikes and high surf. But Patzert cautioned that El Niño events are not drought busters. "Over the long haul, big El Niños are infrequent and supply only seven percent of California’s water," he said.
Then, once El Niño finishes, La Niña could cause its own problems...
Illinois State Climatologist Jim Angel lists all the records Illinois set last year:
- The warmest December on record: 4.8°C, 5.9°C above average.
- The second warmest September – December on record: 11.8°C, 2.7°C above average.
- The 8th coldest February on record: -7.0°C, 6.4°C below average.
- Annual: 11.6°C, 0.2°C above average (not ranked, but of interest)
Precipitation:
- The second wettest December on record 170.1 mm, 101.8 mm above average.
- The wettest November-December on record: 312.4 mm, 156.2 mm above average.
- The wettest June on record: 239.8 mm, 132.8 mm above average.
- The 6th wettest year on record: 1232 mm, 217 mm above average.
So far, January is a little warmer than average. We'll see what El Niño brings later on.
First, from the scientist behind Deeply Trivial, a Times report that giving people money to answer survey questions makes their answers more accurate:
[W]hen you ask people about the economy, the answers are less a statement of objectivity and more like what they’d say if you’d asked which pro football team was the best. That has important implications for democracy. How can people judge whether a party is effective if there is no sense of objective truth? And it could even have implications for the economy itself if, for example, conservative-leaning business executives freeze hiring or investment when the president doesn’t share their politics.
[W]hen money was added to the equation, questions about the economy became less like asking people which football team they thought was best, and more like asking them to place a wager. Even a little bit of cash gets people to think harder about the situation and answer more objectively.
“People are not telling you what they actually believe in ordinary surveys,” [researcher John G. Bullock at the University of Texas at Austin] said. “With a payment, we’re eliciting not necessarily thoughtful responses, but more sincere responses.”
In the same newspaper, Paul Krugman demonstrates that a right-wing trope about academia doesn't mean what they think it means:
Overall, the evidence looks a lot more consistent with a story that has academics rejecting a conservative party that has moved sharply right than it does with a story in which academics have moved left.
Now, you might argue that academics should reflect the political spectrum in the nation — that we need affirmative action for conservative professors, even in science. But do you really want to go there?
No, you really don't.
Here's the semi-annual Chicago sunrise chart. I'm posting it as a regular post in addition to posting it as a permanent page, to maintain deep-linking archiving. The previous post was here.
In just a few hours we'll see the latest sunrise of winter, until the days just before the change back to Standard Time in November. That will bring us something really rare: the latest sunrise in Chicago until November 2027, at 7:29am on November 6th. Thank leap years and orbital eccentricity for that. This statement holds true in all parts of the U.S. and Canada that observe daylight saving time until the first Sunday in November. The worst place to be that morning will be in the U.P. of Michigan, where the sun won't rise until after 8:30am. That's almost British.
| Date |
Significance |
Sunrise |
Sunset |
Daylight |
| 2016 |
| 4 Jan |
Latest sunrise until Oct 28th |
07:19 |
16:33 |
9:13 |
| 28 Jan |
5pm sunset |
07:08 |
17:01 |
9:52 |
| 5 Feb |
7am sunrise |
07:00 |
17:11 |
10:10 |
| 20 Feb |
5:30pm sunset |
06:40 |
17:30 |
10:49 |
| 27 Feb |
6:30am sunrise |
06:30 |
17:39 |
11:08 |
| 12 Mar |
Earliest sunrise until Apr 17th
Earliest sunset until Oct 24th |
06:07 |
17:55 |
11:47 |
| 13 Mar |
Daylight saving time begins
Latest sunrise until Oct 16th
Earliest sunset until Sep 18th |
07:05 |
18:56 |
11:50 |
| 16 Mar |
7am sunrise, 7pm sunset
12-hour day |
07:00 |
19:00 |
11:59 |
| 19 Mar |
Equinox 23:30 CDT |
06:54 |
19:03 |
12:08 |
| 3 Apr |
6:30am sunrise (again) |
06:30 |
19:20 |
12:50 |
| 12 Apr |
7:30pm sunset |
06:15 |
19:30 |
13:15 |
| 22 Apr |
6am sunrise |
05:59 |
19:41 |
13:41 |
| 10 May |
8pm sunset |
05:35 |
20:00 |
14:24 |
| 15 May |
5:30am sunrise |
05:30 |
20:05 |
14:35 |
| 14 Jun |
Earliest sunrise of the year |
05:15 |
20:28 |
15:13 |
| 20 Jun |
Solstice 17:34 CDT
8:30pm sunset |
05:16 |
20:30 |
15:14 |
| 26 Jun |
Latest sunset of the year |
05:17 |
20:31 |
15:13 |
| 3 Jul |
8:30pm sunset |
05:21 |
20:30 |
15:09 |
| 16 Jul |
5:30am sunrise |
05:30 |
20:24 |
14:54 |
| 8 Aug |
8pm sunset |
05:52 |
20:00 |
14:08 |
| 16 Aug |
6am sunrise |
06:00 |
19:50 |
13:50 |
| 29 Aug |
7:30pm sunset |
06:14 |
19:29 |
13:14 |
| 14 Sep |
6:30am sunrise |
06:30 |
19:03 |
12:32 |
| 15 Sep |
7pm sunset |
06:32 |
19:00 |
12:28 |
| 22 Sep |
Equinox, 9:21 CDT |
06:39 |
18:48 |
12:08 |
| 25 Sep |
12-hour day |
06:42 |
18:42 |
12:00 |
| 2 Oct |
6:30pm sunset |
06:50 |
18:30 |
11:40 |
| 11 Oct |
7am sunrise |
07:00 |
18:15 |
11:15 |
| 21 Oct |
6pm sunset |
07:11 |
18:00 |
10:48 |
| 5 Nov |
Latest sunrise until 6 Nov 2027 (!)
Latest sunset until Feb 27th |
07:29 |
17:40 |
10:10 |
| 6 Nov |
Standard time returns
Earliest sunrise until Feb 26th
6:30am sunrise |
06:30 |
16:38 |
10:08 |
| 15 Nov |
4:30pm sunset |
06:42 |
16:30 |
9:48 |
| 1 Dec |
7am sunrise |
07:00 |
16:21 |
9:20 |
| 7 Dec |
Earliest sunset of the year |
07:06 |
16:20 |
9:14 |
| 21 Dec |
Solstice, 04:44 CST |
07:16 |
16:23 |
9:07 |
You can get sunrise information for your location at wx-now.com.
Here are some numbers illustrating 2015 (cf. 2014 also):
- I took only 14 trips and flew only 25 segments, visiting 7 states and 4 countries*.
- Of those, 11 flight segments took off or landed outside the US, which is the highest proportion of international-to-domestic flights in any single year. Those years in which I've flown more international segments were also heavy-travel years in general. For example, in 2001, my heaviest travel year ever, I flew 15 international segments—my record—out of 63 total—also my record.
- I flew 67,187 km, barely re-qualifying (with bonus points) for American Airlines elite status.
- The Daily Parker had 493 posts, the lowest since 2010. The daily mean dropped to 1.35, continuing a slight downward trend since 2013.
- Chargeable hours no longer made any difference as I no longer work as a consultant. However, I did log 148.82 hours walking Parker, 10 more than in 2014.
- Reading suffered a bit. I started 21 books but only finished 15. On the other hand, I went to more operas in 2015 than any year previously, and also ate at more Michelin-starred restaurants than in the preceding 45 years combined.
- 2015 was the first full year for which I have complete Fitbit statistics. During the year, I walked 4.67 million steps, averaging 12,787 per day; slept 2,287 hours, averaging 6.3 per night; and had a net loss of 1.2 kg. (Though at one point in 2015 I had lost 4.1 kg, and am now hoping that the slight bump in November and December was simply holiday food.)
In 2016, I expect more travel, more Daily Parker posts, about the same number of books, and the same number of live performances.
* Germany, Poland, the UK, and Italy; DC, Virginia, New York, Wisconsin, Indiana, Arizona, California, and Texas.
Happy New Year from the Daily Parker. It's just past midnight in Chicago, so it's the "real" new year for me and everyone I'm with.
Here's to 2016 improving on 2015, no matter who you are or how good 2015 turned out.
It's just past midnight UTC, so happy new year to all the world's properly-configured computers, wherever they may be. And to the UK, Portugal, and much of West Africa.